The R Project - The Use of R in Official Statistics - uRos2018 - Presentations

Tutorials
Jaap Walhout
Fast & efficient data manipulation with data.table
Jaap Walhout, Statistics Netherlands

https://github.com/jaapwalhout/data.table-tutorial-uros2018
Martijn Tennekes
Plotting spatial data in R
Martijn Tennekes, Statistics Netherlands
https://github.com/mtennekes/tmap-workshop
Edwin J. and Mark L.
So your Data is Tidy. But is it Clean?
Edwin de Jonge and Mark van der Loo, Statistics Netherlands
https://github.com/data-cleaning/uRos2018_tutorial
Egge-Jan P. and Willy T.
Spatial Analysis in R with Open Geodata
Egge-Jan Pollé and Willy Tadema, Tensing GIS Consultants, Provincie Groningen
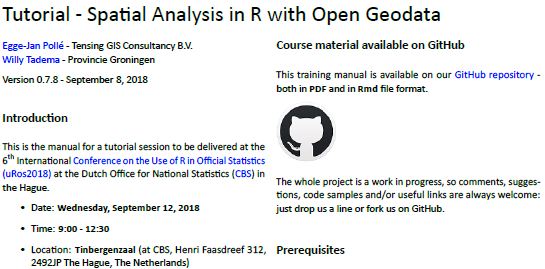
https://github.com/TWIAV/Spatial_Analysis_in_R_with_Open_Geodata
Giulio Barcaroli
Use of R package SamplingStrata for the Optimal Stratification of Sampling Frames for Multipurpose Sampling Surveys
Giulio Barcaroli, ISTAT, Italy
https://github.com/barcaroli/SamplingStrata-Tutorial
Presentations
Thomas Lo Russo
A Corporate Design Toolbox for R
Thomas Lo Russo, Statistical Office of the Canton of Zurich
Kazuhiro Minami and Yutaka Abe
A First Step towards Statistical Disclosure Control on Multiple Tables Under the Presence of Differential Attacks
Kazuhiro Minami and Yutaka Abe, Institute of Statistical Mathematics / National Statistics Center, National Statistics Center
Romain Lesur
Alternative to LaTeX for high quality report generation with rmarkdown
Romain Lesur, Ministère de la Justice
Matthias Gomolka
An internal package for automated metadata documentation
Matthias Gomolka, Deutsche Bundesbank
Manolo Malaver-Vojvodic
Canadian Consumer Price Index (CPI) Dashboard built using R Shiny
Manolo Malaver-Vojvodic, Statistics Canada

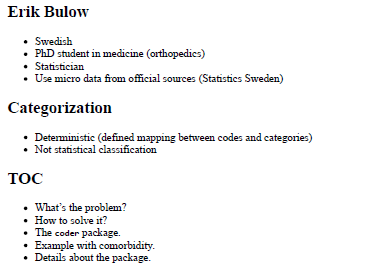
Erik Bülow
coder: An R-package for fast classification of item data into groups
Erik Bülow, The Swedish Hip Arthroplasty Register, Department of Orthopaedics, Institute of clinical sciences at the Sahlgrenska academy of University of Gothenburg, Sweden
Atanaska Nikolova
Combining JDemetra+ and R for Analysing and Visualising Time Series in Official Statistics
Atanaska Nikolova, Office for National Statistics
Kazumi W., Mariko K. and Hiroe T.
Comparison of multivariate outlier detection methods for nearly elliptically distributed data
Kazumi Wada, Mariko Kawano and Hiroe Tsubaki, National Statistics Center
Matjaž Jeran
Easily translatable Shiny applications
Matjaž Jeran, Bank of Slovenia
Edwin de Jonge
Errorlocate: finding errors in data
Edwin de Jonge, Statistics Netherlands
Tobias Göllner and Johannes Klotz
Estimating Differential Mortality from EU-SILC UDB Longitudinal Data
Tobias Göllner and Johannes Klotz, Statistics Austria
Konstantinos Soulanis
Evaluation of estimation methods for a new survey of the UK’s Office for National Statistics (ONS) using R
Konstantinos Soulanis, Office for National Statistics
Hanjo Odenaal
Evidence for the use of alternative data sources to track consumer and business confidence within emerging markets using sentiment based techniques
Hanjo Odenaal, Bureau of Economic Research of South Africa
Bernhard Meindl and Alexander Kowarik
Experiences in the migration to RStudio-Server in Statistics Austria
Bernhard Meindl and Alexander Kowarik, Statistics Austria
Nicoleta C., Ana-Maria C. and Raluca D.
From challenges to opportunities: The Romanian Case of Use R in Official Statistics
Nicoleta Caragea, Ana-Maria Ciuhu and Raluca Mariana Dragoescu, National Institute of Statistics, Ecological University of Bucharest, Institute of National Economy, Romanian Academy
Aoife O’Neill
How R is improving the dissemination of statistics within the Department for Work and Pensions
Aoife O’Neill, Department for Work and Pensions
Victoria Avila
How the Scotish Government is moving towards R
Victoria Avila, National Records of Scotland
Peter Tibert Stoltze
Introducing R at Statistics Denmark – a not entirely completed how-to
Peter Tibert Stoltze, Statistics Denmark
Sami Diaf
Investigating Chaos in Time Series: Evidence from the Cryptocurrency Market
Sami Diaf, Information Systems and Machine Learning Lab (ISMLL), Universität Hildesheim

Yutaka A., Kiyomi S. and Hitotsubashi Ryota C.
Optimal Boundary Value for Creating Anonymized Microdata: Empirical Analysis based on Economic Survey Data
Yutaka Abe, Kiyomi Shirakawa and Hitotsubashi Ryota Chiba, Hitotsubashi University / National Statistics Center, Hitotsubashi University, National Statistics Center
Yukako T., Shinya I. and Mika S.-I.
Overlapping classification for autocoding system
Yukako Toko, Shinya Iijima and Mika Sato-Ilic, Hitotsubashi University / National Statistics Center, National Statistics Center, Research and Development Division, Faculty of Engineering, Information and Systems, University of Tsukuba
Bogdan O., David S., Luis S., and Ciprian A.
pestim - an R package to compute population estimations using mobile phone data
Bogdan Oancea, David Salgado, Luis Sanguiao, and Antoniade Ciprian Alexandru, University of Bucharest and National Statistics Institute of Romania, Dept. Methodology and Development of Statistical Production, INE, Ecological University of Bucharest and National Statistics Institute of Romania
Susie Fortier and Steven Thomas
(R)evolution of generalized systems and statistical tools at Statistics Canada
Susie Fortier and Steven Thomas, Statistics Canada
evolution.png)
Elisa E., Soledad S. and David S.
SelEdit… - a collection of R packages to implement some optimization-based selective editing techniques
Elisa Esteban, Soledad Saldaña and David Salgado, Dept. Methodology and Development of Statistical Production, INE
Brandon Kopp
The Use of R Shiny at the U.S. Bureau of Labor Statistics
Brandon Kopp, Department for Work and Pensions, USA
Pedro S., Conceição F., Inês R. and Pedro C.
Two main uses of R in Statistics Portugal: sampling and confidentiality
Pedro Sousa, Conceição Ferreira, Inês Rodrigues and Pedro Campos, Statistical Methods Unit, Statistics Portugal
Matt Mayhew
Using R for analysis and production of Price Indices for the Production and Services sector of the economy
Matt Mayhew, Office for National Statistics, UK
Eleanor L., Vahé N. and Ria S.
Using R for variance estimation in social surveys
Eleanor Law, Vahé Nafilyan and Ria Sanderson, Office for National Statistics
Oscar de León
Using R to access official data from the Guatemalan National Institute of Statistics
Oscar de León, Centro de Estudios en Salud, Universidad del Valle de Guatemala

 |
 |